
Map:
Interactive Map Project
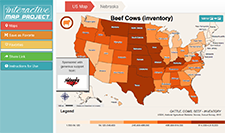
Use this interactive map to help students see how geography and climate affects the production of agricultural crops. The map has USDA statistics built in to allow your students to answer questions such as, "Which state(s) produce the most cattle?" "Where does [my state] rank nationally in corn production?" "What region of the United States produces the most cotton?" etc. There are many agricultural maps available including field crops such as corn, wheat, barley, and alfalfa in addition to fruit and vegetable crops, ornamental nursery crops, and livestock.
Lessons Associated with this Resource
Author
Nebraska Farm Bureau Foundation for Agriculture | Nebraska Agriculture in the Classroom