Skip to content

Companion Resources

Showing 112 of 32 results
first page of the aquaculture flowchart

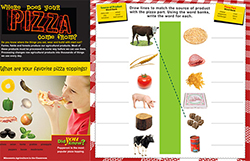
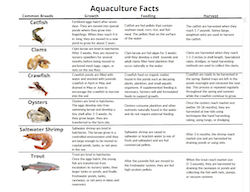
Aquaculture Flowchart

  • Poster/Infographic

This three-page informational sheet describes the processes of how aquaculture food products are grown and harvested, how they get from the farm to the store, and nutrition facts. Words and graphics are used to portray this information for catfish, clams, crawfish, oysters, saltwater shrimp, and trout. Print your own or order a set of 30" x 8" printed charts from agclassroomstore.com.

various vegetables

Vegetables Flowchart

  • Poster/Infographic

This six-page informational sheet describes the process of how vegetables are grown and harvested, how they get from the farm to the store, and nutrition facts. Words and graphics are used to portray this information for asparagus, beets, broccoli, cabbage, carrots, celery, lettuce, onions, potatoes, and radishes. Print your own or order a set of 30" x 8" printed charts from agclassroomstore.com.

Environmental Footprint of Food Poster

  • Poster/Infographic

Discover the hidden environmental costs behind the food we eat! This 18"x24" folded poster highlights key factors in the ecological footprint of food production, from farm-to-table. Perfect for engaging students in discussions about sustainability. Use this poster to spark meaningful conversations on how food choices impact the planet!

cherries, pears, apples, peaches, and oranges

Tree Fruits Flowchart

  • Poster/Infographic

This three-page informational sheet describes the process of how tree fruit crops are grown and harvested, how the products get from the farm to the store, and nutrition facts. Words and graphics are used to portray this information for apples, cherries, oranges, peaches, and pears. Print your own or order a set of 30" x 8" printed charts from agclassroomstore.com.

various oilseeds like soybeans, sunflowers, canola

Oilseeds Flowchart

  • Poster/Infographic

This three-page informational sheet describes the process of how oilseed crops are grown and harvested, how the products get from the farm to the store, and nutrition facts. Words and graphics are used to portray this information for canola, cottonseed, peanuts, soybeans, and sunflower seeds. Print your own or order a set of 30" x 8" printed charts from agclassroomstore.com.

bowls of various grains

Grains Flowchart

  • Poster/Infographic

This three-page informational sheet describes the process of how grains are grown and harvested, how they get from the farm to the store, and nutrition facts. Words and graphics are used to portray this information for barley, corn, oats, rice, rye, sorghum, and wheat. Print your own or order a set of 30" x 8" printed charts from agclassroomstore.com.

assortment of nuts

Nuts Flowchart

  • Poster/Infographic

This six-page informational sheet describes the process of how nuts are grown and harvested, how they get from the farm to the store, and nutrition facts. Words and graphics are used to portray this information for almonds, Brazil nuts, cashews, hazelnuts, macadamia nuts, peanuts, pecans, pine nuts, pistachios, and walnuts. Print your own or order a set of 30" x 8" printed charts from agclassroomstore.com.

strawberries, blueberries, raspberries, blackberries, and cranberries

Berries Flowchart

  • Poster/Infographic

This three-page informational sheet describes the process of how berries are grown and harvested, how they get from the farm to the store, and nutrition facts. Words and graphics are used to portray this information for strawberries, blueberries, cranberries, raspberries, and blackberries. Print your own or order a set of 30" x 8" printed charts from agclassroomstore.com.

Stop the Invasion Fact Sheet Set

  • Poster/Infographic

With the Stop the Invasion Fact Sheet Set, students will read about six different invasive species, the damage they cause and how to stop their spread. Download the entire set.

Nutrition Posters

  • Poster/Infographic

How would you rather eat calcium, fiber, iron, protein, vitamin C, and zinc? This set of posters provides examples of foods that fit into each category and includes nutrition information about each.

Creative Solutions to Ending School Food Waste

  • Poster/Infographic

Americans waste enough food every day to fill a 90,000 seat football stadium. Approximately one-third of all food is wasted at the retail and consumer levels. While research has shown that food wasted by children is similar to the rest of the U.S. population, there are many ways schools can reduce food waste and teach students about the impact it has on the environment and in their community.

Where Does Your Pizza Come From?

  • Poster/Infographic

Farmers Make Great Pizza! Use this student poster to discover the connections between your favorite pizza ingredients and toppings, and agriculture. These are available to educators free of charge from Minnesota Agriculture in the Classroom.